
How to Verify Low-Tracking Cat Litter: 4 Test Methods Importers Should Request from Factories
Definition. Tracking is the granules a cat carries out of the box on its paws. Verification: four repeatable tests — particle morphology (angular granules track less), sieve analysis (dust fines), track test (weigh tracked granules after 10 paw-steps), drop test (clump stays intact). Each test needs a reference range in the OEM spec, not a marketing claim.
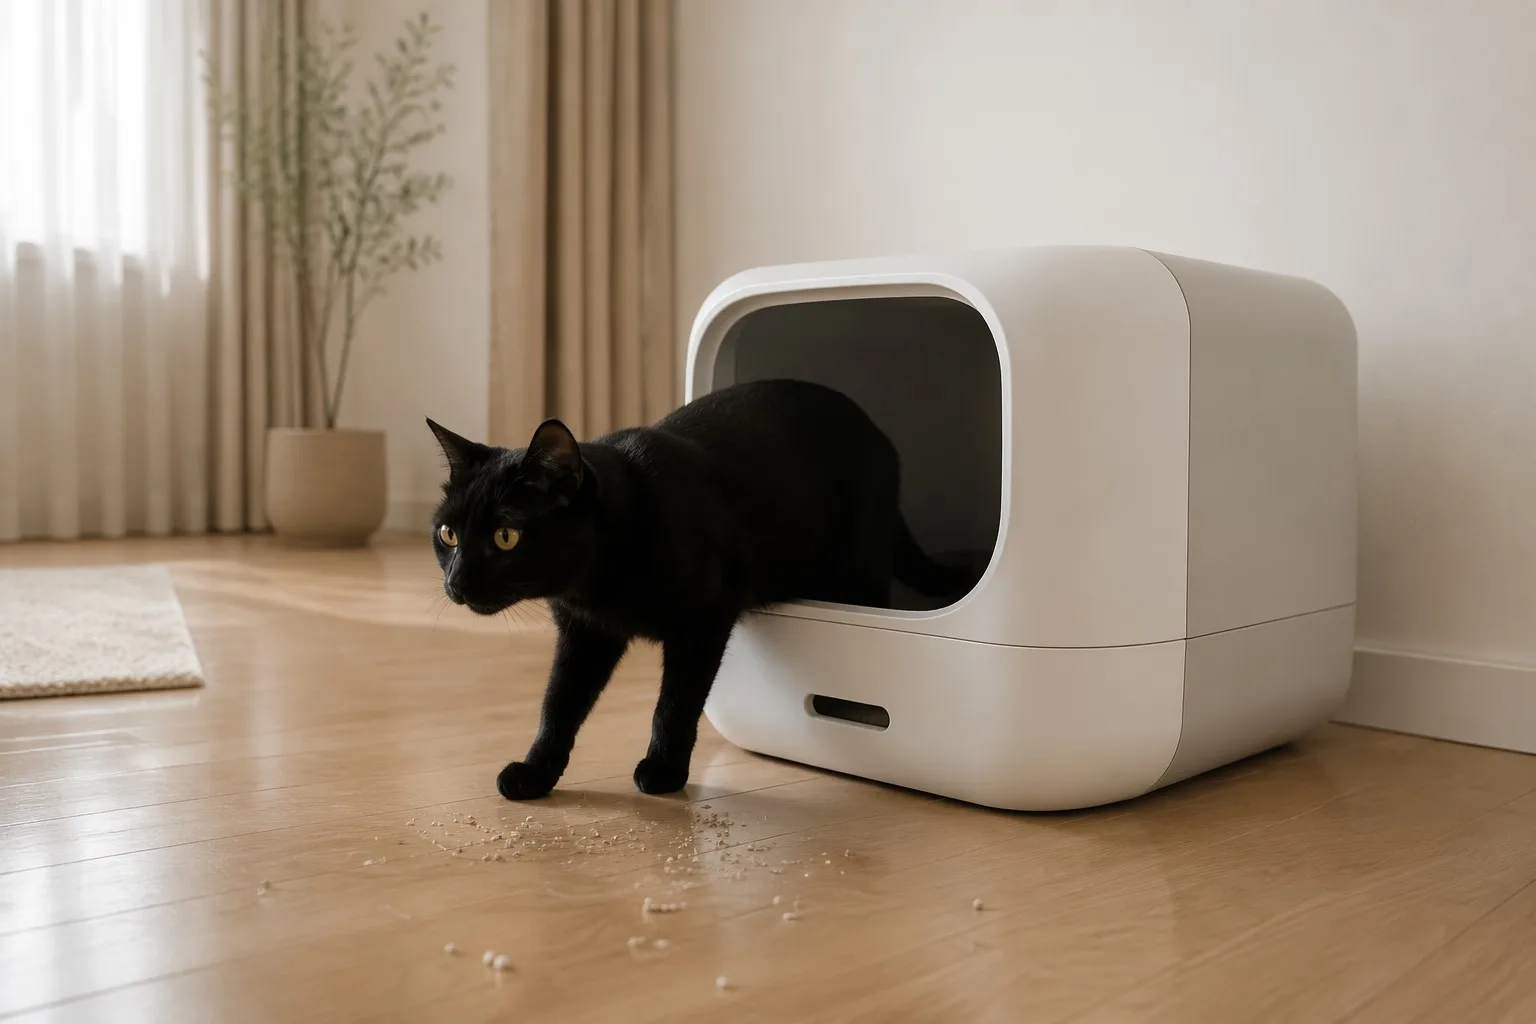
Who this is for: Cat litter OEM brand owners, importers, and procurement managers.
1. Why "Low Tracking" Has No Industry Standard
If you are reading this, you have probably experienced something like this: a supplier assures you their litter is "low tracking" and "almost no track-out," but when the sample arrives and a cat uses it, the area around the box looks like a snowstorm. You confront the factory, and they respond: "Our formula is low-tracking. Maybe your cat digs too aggressively."
This reflects a common challenge in the current cat litter sourcing market.
"Low tracking" has no unified ISO, ASTM, or EN standard specifically for consumer cat litter tracking performance. Unlike dust content, where established particulate measurement methods exist, or moisture content, which follows predictable oven-dry protocols, tracking performance sits in a regulatory void. Most factories determine "low tracking" by feel — the particles seem larger, the granules seem heavier, therefore they assume less tracking. But assumptions do not hold up in a contract.
In our experience working with importers across multiple markets, tracking performance is one of the most frequent points of contention between buyers and suppliers. Not necessarily because the litter actually tracks excessively, but because the buyer and seller never agreed on what "tracking" means, how to measure it, and what threshold constitutes acceptable performance. "Low tracking" written in a contract without an attached test method, without attached data, and without an attached acceptance criterion may be difficult to enforce in a quality dispute.
So if you are a brand preparing for OEM, or an importer evaluating new suppliers, your first question should not be "Is your litter low tracking?" It should be:
"What method do you use to test it? What are the numbers? Which benchmark product are you comparing against?"
2. First, Define What You Are Measuring
In our evaluation framework, tracking is not simply "the cat walks out and particles fall off." It is quantifiable adhesion and scattering. We break it into two distinct mechanisms:
- Paw Embedding: Particles become lodged in the crevices between toe pads and in the folds of the paw pad skin, then are carried out. This depends on particle morphology — sphericity, angularity, and the proportion of fine particles in the size distribution.
- Static Fur Adhesion: Lightweight dust or fine particles cling to cat fur through electrostatic charge, then are shaken off as the cat moves. This depends on dust content, moisture level, and the material's surface resistivity.
These two mechanisms require completely different test approaches. If you only test one, your conclusion is incomplete — you may believe you have controlled paw embedding, only to find fine particles from fur adhesion scattered across the living room.
Key insight: True low-tracking means controlling both paw embedding and static fur adhesion simultaneously. A litter with low dust is not necessarily low-tracking, because large particles lodged between paw pads will still be carried out.
3. Test 1: Particle Morphology Documentation (Not Adjectives)
Common factory claim: "Our granules are round."
Your response: "Please provide microscope images of this batch with aspect ratio and angularity counts."
Ask the factory to provide optical microscope or high-resolution macro photographs (20×–50× magnification), labeled with batch number and imaging date. You are not looking for adjectives like "round" — you are looking for three quantifiable indicators:
| Parameter | Method | Internal Reference Range for Low Tracking |
|---|---|---|
| Aspect Ratio (longest axis / shortest axis) | Image analysis, 50 random particles, mean value | ≤1.5 (closer to 1.0 = more spherical) |
| Surface Angularity Count | Image analysis, count sharp protrusions per particle (radius of curvature <0.1 mm) | ≤3 per particle |
| Fines Fraction (<0.5 mm) | Sieving + image area estimation | ≤3% by area |
The physical prerequisite for low tracking: the more spherical the particle, the smoother the surface, and the lower the fines content, the lower the probability of paw embedding. If a factory cannot even produce microscope images of their particles, you can skip the remaining tests — this may indicate limited particle-level quality control capability.
4. Test 2: Static Pour Dust (Drop Height Matters)
Common factory claim: "Our dust rate is ≤0.1%."
Your response: "What method did you use? What mesh size? Was there a drop-height component?"
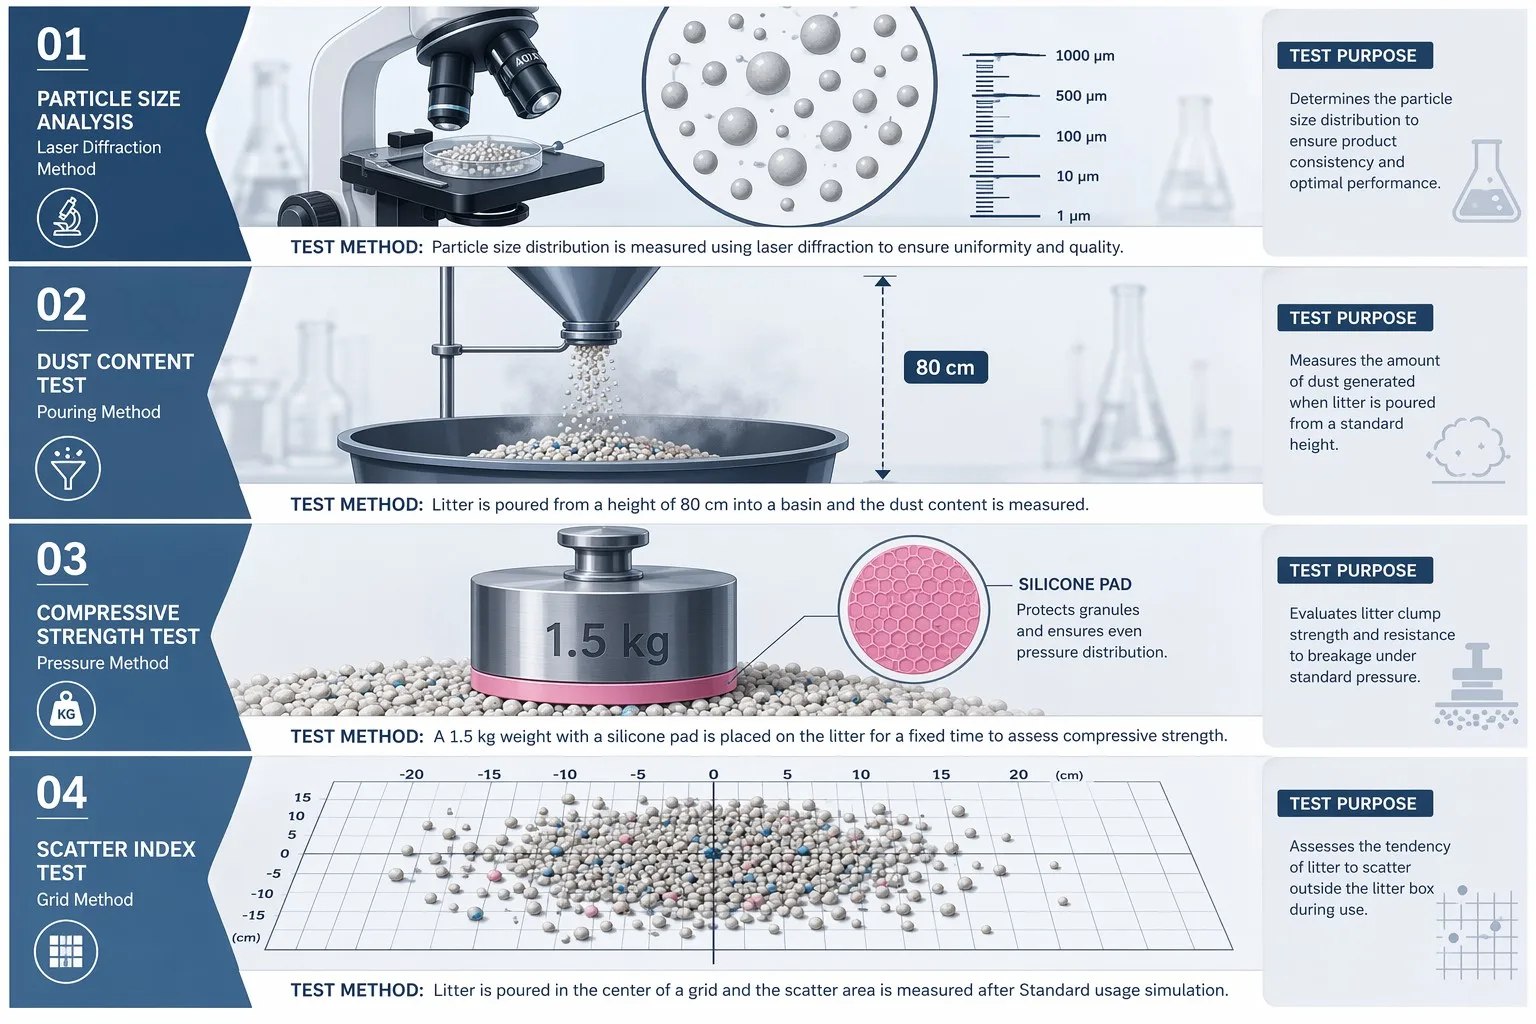
Many people run litter through a 200-mesh sieve and call the result a "dust rate." That data has limited practical value, because in actual use, cat litter is poured — there is a vertical drop, and that drop is what generates respirable dust. Static sieving cannot capture this.
Standardized pour-dust method (internal reference):
| Parameter | Setting |
|---|---|
| Sample Size | 2 kg |
| Pour Height | 80 cm (simulates pouring from bag into litter box) |
| Funnel Orifice | Fixed 8 cm diameter, gravity flow |
| Collection Container | 40 cm diameter basin |
| Dust Meter Position | 30 cm lateral from impact point |
| Recorded Metrics | PM2.5 peak, PM10 peak |
| Replicates | 3, averaged |
If a dust meter is not available, a visual settling range method can be used: place black cardstock around the collection basin, photograph after pouring, and record the maximum diameter of visible white dust coverage. The critical requirement is height consistency — if your pour height varies between tests, the data is not comparable.
Practical observation: Many samples marketed as "low tracking" fail at the pour-dust stage. When dust levels are high, fine particles adhere to cat fur and are carried throughout the home. Dust and tracking are not separate problems — they are coupled through the electrostatic adhesion mechanism.
5. Test 3: Simulated Paw Pad Adhesion (Silicone, Not Human Hands)
Common factory claim: "Our granules are heavy, they won't stick."
Your response: "Please run an adhesion test with Shore A20 silicone pad and send me the video."
This is the most frequently overlooked test, yet it is the one that most clearly separates genuinely low-tracking formulations from verbal claims.
Standardized paw pad simulation method (internal reference):
| Parameter | Setting | Rationale |
|---|---|---|
| Weight Mass | 1.5 kg | Simulates single-paw pressure of a 4–5 kg adult cat |
| Bottom Surface Material | Silicone pad, Shore A hardness 20 ±2 | Approximates cat paw pad elasticity |
| Silicone Thickness | 3 mm | — |
| Drop Height | 5 cm | Simulates natural stepping motion |
| Contact Duration | 2 seconds | Simulates paw settling |
| Replicates | 10, discard highest and lowest, average remainder | — |
| Measurement | Mass of adhered particles (mg), 0.01 g balance | — |
Internal assessment range: ≤50 mg per test is considered excellent; 50–120 mg is acceptable; >120 mg suggests formula improvement is needed.
The value of this test lies in its repeatability. Silicone provides a repeatable simulation surface for comparison testing — its friction coefficient, elasticity, and surface energy characteristics allow for consistent, reproducible measurements. Request a test video (not a photograph — a continuous video) from the factory, not just a number. The video should clearly show the weight label, the silicone pad specification, and the weighing process before and after.
6. Test 4: Walk-Out Area and Residual Mass (Closest to Real Usage)
The first three tests are component-level — they examine particle morphology, dust, and adhesion individually. The fourth test is system-level — it simulates the complete usage scenario.
Standardized walk-out simulation method (internal reference):
| Parameter | Setting |
|---|---|
| Tray Dimensions | 1 m × 0.5 m |
| Litter Depth | 3 cm |
| Simulated Steps | 6 steps (simulates initial steps exiting the litter box) |
| Landing Surface | White paper, ≥1 m × 1 m |
| Measured Metrics | ① Scattered particle coverage area (cm², grid-paper method) ② Collected particle mass (g) |
Grid-paper method: Pre-mark the white paper with a 1 cm × 1 cm grid. After the test, photograph and count the number of grid cells containing particles (using counting software or manual tally). Smaller area means more concentrated track-out, which is easier to clean.
Internal assessment range: Coverage area ≤50 cm² with residual mass ≤0.5 g is considered excellent — corresponding to virtually imperceptible tracking in daily use.
This test simulates the "first few steps out of the litter box" scenario. Internally, we require comparison data against a commercially available benchmark product for every formulation — not just historical self-comparison.
📸 Suggested image: Before-and-after white paper comparison photographs with grid-counting overlay.
7. Material-Specific Optimization Directions
It is not that a particular material is inherently low-tracking — it is about which direction it has been optimized in. Each material has its own physics, and the optimization strategy is completely different.
| Material | Primary Tracking Mechanism | Optimization Direction | Key Verification Point |
|---|---|---|---|
| Tofu Litter | Fragmentation debris > paw embedding | Increase pellet hardness (≥55 N internal target), reduce breakage | Hardness test report + debris rate (%) |
| Bentonite Litter | Fine-particle embedding > fur adhesion | Improve sphericity (sodium bentonite > calcium bentonite), control <0.5 mm fraction | Particle aspect ratio + 200-mesh pass rate |
| Cassava Litter | Static adhesion > paw embedding | Control moisture (4%–8% internal reference), add anti-static treatment | Moisture report + surface resistivity test |
| Blended Litter | Depends on blend logic | Must provide documented blend rationale for particle size and shape distribution | Blend specification + individual component test data |
| Silica Gel | Lightweight, easily carried | Increase single-particle density, increase particle size | Density + particle size distribution |
A critical warning: if the factory cannot explain the design rationale behind their formulation — why this particle size, why this moisture level — and only says "good raw materials" or "good formula," proceed with caution. Effective low-tracking formulations are engineered, not stumbled upon.
🔗 Related reading: Bentonite Clumping Problems Start at the Raw Mineral · Cat Litter Sourcing: Stop Obsessing Over Factory Price
8. What to Request When Evaluating Samples
Not a one-line statement claiming "low tracking," but a data package:
- ✅ Raw data sheets for all four tests on this batch — including tester name, date, ambient temperature and humidity (temperature and humidity affect both dust behavior and moisture content).
- ✅ Particle microscope images — ≥20× magnification, color, with scale bar.
- ✅ Comparison test record against a commercially available benchmark product — covering at minimum pour-dust and paw-pad adhesion. Data without a benchmark is meaningless.
- ✅ If third-party testing was conducted: testing body name and report number — verifiable, not just claimed.
If you cannot obtain these, your sample evaluation remains at the "hand-feel" stage. And hand-feel evaluation has one consistent outcome: the sample passes, but the production batch fails. This is the most common pitfall in cat litter procurement.
9. Frequently Asked Questions
What particle size is best for low-tracking cat litter?
Based on internal testing at Jinan Silk Pet, particle diameters of 1.5–3.5 mm generally show lower paw-embedding risk. Particles that are too small increase embedding probability; particles that are too large may reduce cat acceptance. For tofu litter specifically, 2.0 mm diameter showed good compatibility in selected internal tests with automatic litter box models. These are internal observations, not industry standards.
Is there a third-party lab that tests cat litter tracking?
Currently there is no ISO or ASTM standard method specifically for cat litter tracking, so third-party labs generally do not offer this test. This is why tracking performance has remained a gray area in the industry. The common practice is to request in-house test data and methodology documentation from the factory, and where possible, to have the factory's testing procedures audited by a third party.
Does cat breed and body weight affect tracking results?
Yes. In our observations, long-haired cats such as Ragdolls and Persians show more pronounced electrostatic fur adhesion. Heavier cats create deeper paw embedding. Our test parameters are calibrated around a 4–5 kg body weight, which covers the typical range for most domestic cats.
What is the relationship between dust and tracking?
Dust accelerates tracking. When dust levels are high, fine particles adhere to cat fur through static electricity, and are carried out and scattered even if no large particles are embedded in paw pads. Low tracking performance fundamentally requires low dust — the two are coupled, not independent problems.
10. Get the Internal Test Record Template
We have prepared an editable internal test record spreadsheet containing blank recording templates for all four tests, operation diagrams, and a quick-reference criteria card.
If you are currently comparing samples, contact our product engineering team to request the template. Specify which material types you are interested in (tofu / bentonite / cassava / blended formulations / silica gel), and we will recommend corresponding low-tracking formulations and test samples.
SilkPet Tofu Cat Litter — dust ≤0.05%, particle sizes 1.5 / 2.0 / 3.0 mm
SilkPet Cassava Cat Litter — dust ≤0.05%, 0.5–3.5 mm
SilkPet Bentonite Cat Litter — dust ≤0.1% (ISO 8130), 1.0–3.0 mm
SilkPet Mixed Blend — custom formula and granule engineering
Cat Litter COA: 8 Indicators for Importers — how to audit batch test data
Cat Litter Bulk Density — particle size, dust and container math